Abstract
This study presents a smart grid architecture addressing challenges in renewable energy integration, including limited data use, fragmented analysis, and weak real-time control. The proposed multi-layer framework combines data input, multidimensional analysis, AI optimization, and output evaluation to improve performance. A MATLAB simulation models interactions among load demand, solar and wind generation, battery storage, and grid supply over 24 hours. Results show renewables contribute 60–75% of power, reducing reliance on fossil fuels. Battery storage balances supply and demand, while real-time monitoring, demand response, and automation enhance stability. Energy efficiency reaches about 92%, with lower transmission and distribution losses. Reliability indices (SAIDI 0.02–0.05 hours per customer and SAIFI 0.01–0.03 interruptions) indicate strong system resilience. Economic analysis shows savings of $60,000–$80,000 from reduced fuel use despite higher upfront costs. Environmental benefits include major carbon emission reductions. Socioeconomic impacts include job creation and improved energy access. Overall, integrating renewable energy with advanced smart grid technologies offers a sustainable, efficient, and economically viable solution that supports long-term energy resilience and climate objectives. This approach also enhances system flexibility by enabling adaptive control strategies under varying load and generation conditions, ensuring scalability and future integration of emerging energy technologies and digital grid innovations worldwide adoption.
Keywords
AI-Based Optimization, Carbon Reduction, Energy, Energy Storage, Grid Stability, Renewable Energy, Smart Grid
1. Introduction
The global transition toward sustainable energy systems has become a central priority in response to escalating climate change, environmental degradation, and the depletion of fossil fuel resources. Renewable energy sources (RES), such as solar, wind, hydro, and biomass, are increasingly being deployed to decarbonize power systems and achieve net-zero carbon emissions. However, the integration of these variable and distributed energy resources into conventional power grids presents significant challenges, particularly at the transmission network level. Smart grid technologies have emerged as a transformative solution, enabling enhanced monitoring, control, and bidirectional power flow to facilitate large-scale renewable energy integration. The concept of a smart grid combines advanced communication, automation, and information technologies with traditional electrical infrastructure to create a more flexible, efficient, and resilient power system
| [1] | S. J. Yeboah, “Impact and integration techniques of renewable energy systems in smart grids,” Sustainable Energy Technologies, 2025. |
[1]
. Achieving zero-carbon operation in modern power systems requires not only the deployment of renewable generation but also the effective integration of these resources into existing grid infrastructures. Unlike conventional centralized generation systems, renewable energy sources are inherently intermittent and unpredictable, leading to challenges in maintaining grid stability, frequency regulation, and voltage control. Studies indicate that high penetration of variable renewable energy (VRE) can significantly affect system inertia and increase the complexity of grid operations
. Consequently, the modernization of transmission networks through smart grid technologies is essential to accommodate the dynamic nature of renewable energy while ensuring reliability and power quality. One of the primary technical challenges associated with renewable energy integration is the variability and intermittency of generation. Solar and wind power outputs fluctuate depending on environmental conditions, making it difficult to balance supply and demand in real time. This variability can lead to issues such as voltage instability, frequency deviations, and reduced system reliability, particularly in weak or underdeveloped transmission networks
| [3] | R. P. Lyanda and A. M. Omari, “Smart grids and renewable energy integration: Challenges and technological advancements,” Int. J. Energy Applications and Technologies, 2025. |
[3]
. Furthermore, traditional grids were designed for unidirectional power flow from centralized power plants to consumers, whereas renewable energy integration requires bidirectional flows due to distributed generation. Advanced technologies such as energy storage systems, grid-forming inverters, and real-time monitoring tools are therefore necessary to mitigate these challenges and enhance grid flexibility
| [4] | C. C. Nzeanorue and B. C. Okpala, “Smart grids and renewable energy integration: Challenges and solutions,” Engineering Science & Technology Journal, 2024. |
[4]
. In addition to technical constraints, economic factors play a critical role in the integration of renewable energy into smart grid transmission networks. The transition to a zero-carbon grid requires substantial capital investment in infrastructure upgrades, including transmission expansion, energy storage deployment, and digitalization of grid operations. Recent studies highlight that the high cost of grid modernization and renewable integration remains a significant barrier, particularly in developing economies
| [3] | R. P. Lyanda and A. M. Omari, “Smart grids and renewable energy integration: Challenges and technological advancements,” Int. J. Energy Applications and Technologies, 2025. |
[3]
. Moreover, the economic feasibility of renewable energy projects is influenced by factors such as market structures, pricing mechanisms, and investment risks. The need for cost-effective solutions, such as optimized energy management systems and hybrid energy models, has become increasingly important to ensure the financial sustainability of smart grid implementations
| [5] | S. Dawn et al., “Integration of renewable energy in microgrids and smart grids,” Advanced Energy & Sustainability Research, 2024. |
[5]
. Regulatory and policy challenges further complicate the integration process. Existing regulatory frameworks in many countries are not adequately designed to support the large-scale deployment of renewable energy and smart grid technologies. Issues such as outdated grid codes, lack of standardized interconnection procedures, and unclear policies for independent power producers can hinder the adoption of renewable energy systems
| [3] | R. P. Lyanda and A. M. Omari, “Smart grids and renewable energy integration: Challenges and technological advancements,” Int. J. Energy Applications and Technologies, 2025. |
[3]
. Standards such as IEEE 1547 and IEEE 2030 have been developed to address interoperability and interconnection challenges, but their implementation varies across regions, leading to inconsistencies in grid integration practices
| [6] | IEEE Standards Association, “IEEE 1547 and IEEE 2030 standards for smart grid interoperability and distributed resource integration,” IEEE, 2024. |
[6]
. Additionally, regulatory mechanisms must evolve to accommodate emerging technologies such as distributed energy resources (DERs), virtual power plants (VPPs), and demand response systems, which play a crucial role in enhancing grid flexibility and efficiency. Another important dimension of renewable energy integration is the role of digitalization and advanced control strategies. Smart grids leverage technologies such as artificial intelligence, machine learning, and Internet of Things (IoT) devices to enable real-time monitoring, predictive analytics, and automated decision-making. These technologies can improve load forecasting, optimize energy dispatch, and enhance system resilience in the face of uncertainties associated with renewable generation
| [5] | S. Dawn et al., “Integration of renewable energy in microgrids and smart grids,” Advanced Energy & Sustainability Research, 2024. |
[5]
. Furthermore, the integration of advanced communication systems allows for better coordination between generation, transmission, and distribution networks, facilitating a more efficient and reliable energy system. Despite these advancements, several challenges remain in achieving a fully integrated, zero-carbon smart grid. The complexity of managing large-scale renewable energy systems, coupled with the need for significant investments and regulatory reforms, underscores the importance of a holistic approach that considers technical, economic, and policy aspects. Addressing these challenges requires coordinated efforts among governments, utilities, researchers, and industry stakeholders to develop innovative solutions and implement supportive policies
| [7] | A. G. Phadke and J. S. Thorp, “Synchronized phasor measurements and their applications in the smart grid,” IEEE Trans. Smart Grid, vol. 14, no. 2, pp. 987–996, Mar. 2023. |
[7]
. This research aims to explore the integration of renewable energy sources into smart grid transmission networks with a focus on achieving zero-carbon operation. It examines the key technical challenges, including grid stability, energy storage, and system control, as well as economic considerations such as cost optimization and investment strategies
| [8] | M. A. Hannan et al., “Review of energy storage systems for integrating renewable energy sources into smart grid networks,” IEEE Access, vol. 10, pp. 45612–45638, 2022. |
[8]
. Additionally, the study analyzes regulatory frameworks and policy measures necessary to support the transition to sustainable energy systems
| [9] | Y. Liu, L. Wu, and J. Li, “Regulatory and economic analysis of renewable energy integration in smart grids toward carbon neutrality,” IEEE Trans. Sustainable Energy, vol. 15, no. 1, pp. 112–121, Jan. 2024. |
[9]
. By providing a comprehensive understanding of these challenges and potential solutions, this research contributes to the development of resilient and efficient smart grid infrastructures capable of supporting a zero-carbon future.
2. Integration of Renewable Energy Sources
The integration of renewable energy sources (RES) into modern power systems has become a central focus in addressin global energy challenges, including climate change, energy security, and sustainability. Renewable energy technologies such as solar photovoltaic (PV) and wind power offer environmentally friendly alternatives to conventional fossil fuel-based generation. However, their integration into existing grid infrastructure presents several technical, economic, and operational challenges. Renewable energy integration refers to the process of incorporating variable and distributed energy resources into the power grid while maintaining system stability, reliability, and efficiency. The increasing penetration of renewables requires advanced grid management strategies, energy storage systems, and intelligent control mechanisms
| [10] | A. G. Olabi et al., “Renewable energy systems and smart grid integration: A review,” Renewable and Sustainable Energy Reviews, vol. 152, 2021. |
| [11] | M. A. Hannan et al., “Integration of renewable energy sources into the smart grid: Challenges and solutions,” IEEE Access, vol. 9, pp. 102–123, 2021. |
| [12] | B. Kroposki et al., “Achieving a 100% renewable grid…,” IEEE Power and Energy Magazine, vol. 18, no. 2, pp. 61–73, 2020. https://doi.org/10.1109/MPE.2019.2957039 |
[10-12]
.
2.1. Solar Photovoltaic Systems
Solar photovoltaic (PV) generation is commonly modeled as a function of irradiance and system efficiency:
(1)
The model reflects the daily solar cycle, with zero output at night and peak generation around midday. Solar energy is more predictable than most renewable sources, making it suitable for grid integration when supported by accurate forecasting techniques
| [13] | J. Antonanzas et al., “Review of photovoltaic power forecasting,” Solar Energy, vol. 189, pp. 1–17, 2020.
https://doi.org/10.1016/j.solener.2019.07.045 |
| [14] | H. Yang et al., “Solar irradiance forecasting using machine learning methods,” IEEE Access, vol. 8, pp. 198–210, 2020. |
[13, 14]
. However, weather and daylight variations still create operational challenges.
2.2. Wind Energy Systems
Wind power is stochastic and can be represented as:
(2)
Wind energy supplies power continuously but fluctuates due to changing wind speeds. High wind penetration may affect grid stability, requiring forecasting methods and geographically distributed wind farms to reduce variability
| [15] | Y. Liu et al., “Wind power integration and variability analysis in modern grids,” IEEE Trans. Sustainable Energy, vol. 13, no. 2, pp. 1020–1030, 2022. |
| [16] | S. D. Djurović et al., “Uncertainty modeling of wind power generation,” Renewable Energy, vol. 179, pp. 123–135, 2021. https://doi.org/10.1016/j.renene.2021.07.061 |
[15, 16]
.
2.3. Power Balance and Grid Integration
Grid operation depends on balancing supply and demand:
(3)
High renewable penetration can lead to voltage and frequency deviations caused by power imbalances:
Advanced control methods such as automatic generation control and demand response help maintain system stability
| [17] | P. Kundur et al., “Power system stability and control in modern grids…,” IEEE Trans. Power Systems, vol. 36, no. 4, pp. 3450–3462, 2021. |
| [18] | J. Machowski et al., Power System Dynamics: Stability and Control, 3rd ed., Wiley, 2020. |
[17, 18]
.
2.4. Role of Energy Storage Systems
Battery energy storage systems (BESS) reduce renewable intermittency through charging and discharging operations:
(6)
Energy storage improves grid flexibility, reliability, and frequency regulation, although high costs and battery degradation remain challenges
.
2.5. Smart Grid Technologies
Smart grids integrate communication, automation, and real-time monitoring. Demand response adjusts electricity demand according to available supply:
(7)
Artificial intelligence and forecasting techniques also improve system optimization and prediction accuracy
| [21] | Z. Zhang et al., “Artificial intelligence applications in smart grids: A review,” IEEE Access, vol. 10, pp. 456–478, 2022. |
| [22] | Y. Wang et al., “Deep learning-based load forecasting in smart grids,” IEEE Trans. Smart Grid, vol. 13, no. 3, pp. 2145–2155, 2022. |
[21, 22]
.
2.6. Economic and Environmental Considerations
The economic performance of renewable systems is measured using the levelized cost of energy (LCOE):
(8)
Renewable integration reduces operational costs and greenhouse gas emissions
| [23] | International Renewable Energy Agency (IRENA), “Renewable Power Generation Costs,” 2023. |
[23]
. Major challenges include intermittency, storage limitations, infrastructure constraints, and regulatory barriers.
2.7. Research Gap
Despite progress in renewable energy integration, key research gaps remain. Existing studies often address technical, economic, or environmental factors separately rather than through integrated frameworks. Many models also fail to capture real-time interactions among renewable sources, storage, and grid systems. AI-based control strategies remain underused in real-time optimization. In addition, most studies focus on developed countries, with limited attention to Africa and other developing regions. Energy storage optimization, including sizing and operation, also remains challenging due to cost-performance trade-offs.
2.8. Proposed Architecture Addressing Gap
The proposed architecture provides a multi-layered framework to address major research gaps in renewable energy integration, including fragmented analysis, limited real-time modeling, and insufficient AI-based control. It consists of four layers: Data Input, Integrated Analysis, AI-Based Optimization, and Outputs.
The Data Input layer collects renewable energy, grid/load, economic, environmental, and regional data to support integrated decision-making. The Integrated Multi-Dimensional Analysis layer combines technical, economic, and environmental assessments with real-time system modeling to evaluate system performance under changing conditions.
The AI-Based Optimization and Control layer applies artificial intelligence and machine learning for load forecasting, renewable generation prediction, energy storage management, and smart grid demand response. This improves real-time adaptability and operational efficiency. The Outputs and Impact layer delivers practical benefits, including optimal energy mix coordination, reduced costs and emissions, improved grid stability, and adaptable regional solutions. Overall, the architecture integrates technical, economic, and environmental considerations into a unified system, enabling intelligent renewable energy management and addressing key limitations in existing studies.
3. Proposed Design
The study adopts a descriptive and analytical research design to examine smart grid architectures and renewable energy integration practices. The descriptive aspect reviews existing systems and operational frameworks, while the analytical aspect evaluates system performance, identifies operational challenges, and proposes optimization strategies. The research focuses on three key dimensions:
1) Technical analysis – assessment of grid operation and performance
2) Economic analysis – evaluation of costs and financial feasibility
3) Regulatory analysis – examination of policies and institutional frameworks
3.1. Technical Analysis – Smart Grid Transmission Model
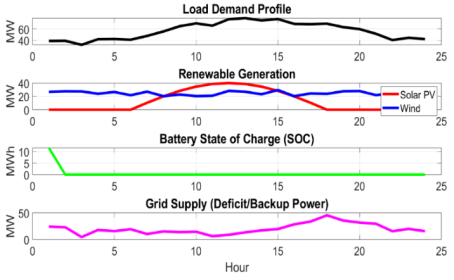
This study presents a MATLAB-based simulation of a smart grid integrating renewable energy sources, battery storage, and grid supply. The analysis focuses on four major components: load demand, renewable generation, battery state of charge (SOC), and grid supply as illustrated in
Figure 1. The simulation demonstrates how these components interact dynamically to satisfy varying electricity demand.
3.1.1. Load Demand Profile
The load demand profile represents hourly electricity consumption over a 24-hour period. Demand is modeled using a sinusoidal function with a stochastic component to reflect real-life uncertainties:
(9)
The model assumes a base demand of 50 MW with a 20 MW variation range, while the random term captures unexpected fluctuations. Peak demand occurs during evening hours, highlighting the need for adaptive energy management in smart grids.
3.1.2. Renewable Generation (Solar and Wind)
Solar generation is represented by:
(10)
This ensures zero output at night and maximum generation around midday. Solar energy is predictable because it depends mainly on solar irradiance. Wind generation is modeled as:
(11)
Unlike solar power, wind energy is stochastic and less predictable but provides continuous generation throughout the day and night.
3.1.3. Battery State of Charge (SOC)
The battery system balances supply and demand through charging and discharging processes:
(12)
The battery stores excess renewable energy and supplies power during shortages, helping to stabilize the system and reduce energy losses.
3.1.4. Grid Supply
Grid power compensates for any energy deficit:
(13)
Grid dependence increases during low renewable output and decreases when renewable generation and battery storage are sufficient.
3.1.5. Overall System Behaviour
The smart grid operates according to the energy balance equation:
(14)
This ensures that electricity demand is continuously met through coordinated contributions from renewable energy, battery storage, and the main grid.
Figure 1. The four major component of the smart grid system.
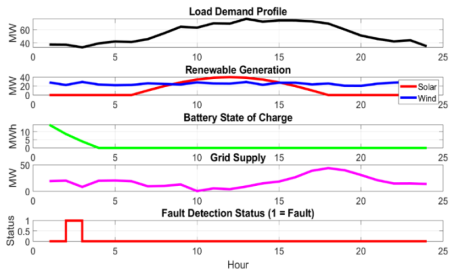
Figure 2. Smart Grid Functionalities.
3.2. Smart Grid Functionalities
3.2.1. Two-Way Communication
A communication signal is established between system components to represent real-time information exchange:
This signal reflects the instantaneous energy imbalance in the system.
(15)
3.2.2. Real-Time Monitoring and Fault Detection
System stability is assessed by tracking simulated voltage and frequency signals.
Figure 2 illustrates the operational features of the smart grid. Faults are identified when predefined limits are surpassed:
Voltage limit: 1.1 p.u.
Frequency limit: 50.5 Hz
A fault is initiated whenever either of these parameters exceeds its specified threshold.
3.2.3. Automation and Control
When a fault is detected, an automatic control response is initiated. This includes implementing load shedding to help restore system stability:
This action lowers the net demand and helps prevent instability within the system.
3.2.4. Power Balance and Grid Interaction
Net demand is calculated as the difference between total load and renewable energy generation. The required grid supply is then determined using the power balance relationship:
(16)
A positive value of grid power signifies dependence on the main grid, whereas smaller values reflect more effective use of locally generated and stored energy.
3.3. Different Scenarios of Renewable Penetration
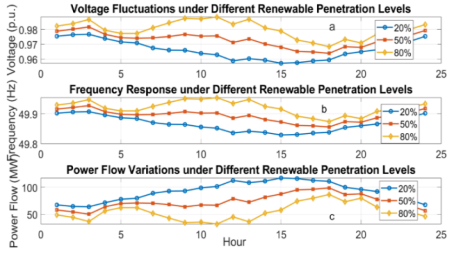
This simulation evaluates the impact of renewable energy penetration levels of 20%, 50%, and 80% on power system performance over 24 hours. The analysis focuses on voltage deviation, frequency response, and power flow characteristics. Results are illustrated in
Figure 3(a): Voltage Response,
Figure 3(b): Frequency Response, and
Figure 3(c): Power Flow Variations. Renewable generation is scaled proportionally to each penetration level for fair comparison.
3.3.1. Load Demand and Renewable Generation
The load demand is modeled as:
(17)
Renewable generation is expressed as:
(18)
where α = {0.2, 0.5, 0.8}. Higher penetration levels increase the contribution of renewable energy to total demand.
3.3.2. Power Mismatch Analysis
The system power imbalance is defined by:
At 20% penetration, power imbalance is mostly negative, showing reliance on conventional generation. At 50% and 80%, surplus and deficit conditions alternate due to renewable variability.
3.3.3. Voltage Response – Figure 3(a) Voltage variation is modeled as:
(20)
At low penetration, voltage remains near 1.0 p.u. Moderate penetration introduces manageable fluctuations, while 80% penetration causes larger voltage rises and drops because of renewable intermittency.
3.3.4. Frequency Response – Figure 3(b) Frequency response is represented by:
(21)
Frequency remains stable at 20% penetration but becomes more variable at higher penetration levels due to reduced system inertia.
3.3.5. Power Flow Characteristics – Figure 3(c) Power flow is given as:
At 20% penetration, centralized generation dominates. At 50%, local renewable contribution increases, while 80% penetration introduces reverse power flow conditions.
Figure 3. Renewable Penetration Scenario Analysis.
3.3.6. Comparative Analysis
Low penetration ensures stability but depends on conventional generation. Moderate penetration provides balanced performance, whereas high penetration reduces grid dependence but increases voltage, frequency, and power flow instability.
3.4. Stability Analysis Techniques
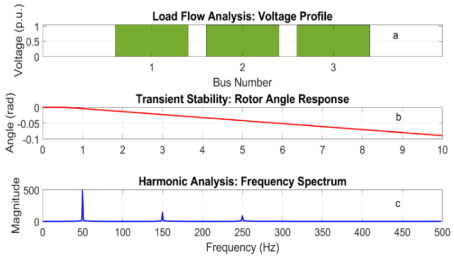
The MATLAB simulation evaluates a 3-bus power system using load flow, transient stability, and harmonic analyses. The results are presented in
Figure 4(a): Voltage Profile
, Figure 4(b): Rotor Angle Response, and
Figure 4(c): Harmonic Spectrum. These analyses provide insight into steady-state operation, dynamic stability, and power quality.
3.4.1. Load Flow Analysis
Load flow analysis is performed using the Gauss–Seidel iterative method. The nodal current relationship is expressed as:
Power injection is represented by:
The voltage profile in
Figure 4(a) shows that the slack bus maintains a constant voltage of 1.05 p.u., while load buses experience slight voltage drops due to transmission impedance. All voltages remain within acceptable operating limits.
3.4.2. Transient Stability Analysis
Transient stability is evaluated using the swing equation:
A disturbance is applied between 0.5 s and 0.7 s to simulate a fault. As shown in
Figure 4(b), the rotor angle increases rapidly during the disturbance but gradually stabilizes after fault clearance. The absence of sustained oscillations confirms that the system maintains synchronism and remains transiently stable.
3.4.3. Harmonic Analysis
Harmonic behavior is analyzed using the Fast Fourier Transform (FFT). The input signal is:
(26)
The harmonic spectrum in
Figure 4(c) shows peaks at 50 Hz, 150 Hz, and 250 Hz, representing the fundamental, third, and fifth harmonics. Although waveform distortion exists, harmonic magnitudes remain moderate and within acceptable power quality limits.
3.5. Comparative Scenario Evaluation
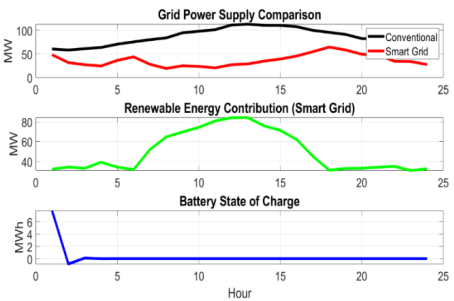
The simulation evaluates two energy supply scenarios over a 24-hour period: a traditional grid system and a smart grid system that incorporates renewable energy sources and battery storage. The outcomes are presented in
Figure 5, including grid power comparison, renewable energy contribution, and battery state of charge.
3.5.1. Load Demand Profile
The load demand is modeled as a time-dependent sinusoidal function with an added random component:
(27)
Figure 4. Stability Analysis Techniques.
.
Figure 5. Conventional Grid Performance.
Accordingly, the total energy supplied by the grid is:
(28)
This formulation represents typical daily consumption patterns, capturing both peak demand periods and random variations. The total energy demand over the simulation period is calculated as:
3.5.2. Conventional Grid Performance
In the conventional case, the entire load demand is met solely by the main grid:
As illustrated in
Figure 5, the grid power mirrors the load profile, indicating complete reliance on centralized generation.
This scenario provides a reference point for assessing the advantages of integrating smart grid technologies.
3.5.3. Smart Grid Operation
The smart grid system integrates both solar and wind power alongside battery energy storage. The combined renewable generation is given by:
Accordingly, the net demand is defined as the difference between load demand and renewable generation:
3.5.4. Battery Dynamics
The battery system functions to maintain balance between energy supply and demand. Its state of charge (SOC) is updated
(33)
The battery charges when there is surplus renewable generation and discharges to support the load during periods of energy shortfall.
3.5.5. Grid Power Reduction
The power supplied by the smart grid is defined as:
(34)
As shown in
Figure 5, the smart grid notably decreases dependence on the main grid compared to the conventional system. The gap between the two profiles highlights the role of renewable sources and storage in satisfying demand. The total grid energy consumption in the smart grid case is:
(35)
3.5.6. Renewable Energy Contribution
Figure 5 illustrates the combined output of solar and wind energy. The total renewable energy generated is given by:
Renewable penetration (or efficiency) is defined as:
The Figure shows that renewable output varies throughout the day, with solar energy available during daylight hours and wind providing a more continuous, though variable, contribution. Together, they enhance energy availability and reduce reliance on the grid.
3.5.7. Battery State of Charge
The variation in battery SOC is depicted in
Figure 5. The SOC rises during periods of excess renewable generation and declines when the battery discharges to meet demand. This demonstrates the battery’s role as an energy buffer, storing su plus energy and supplying it during peak demand or low renewable output. Such operation improves system reliability and minimizes energy losses.
3.5.8. Grid Reduction Performance
The performance of the smart grid is evaluated using the grid reduction metric:
(38)
A higher value indicates a greater reduction in dependence on the conventional grid. Simulation results show a substantial decrease in grid energy usage in the smart grid scenario, emphasizing the benefits of renewable integration and storage in enhancing efficiency and sustainability.
3.5.9. Comparative Analysis
An overall interpretation of
Figure 5 highlights the following:
Grid Supply: Shows reduced reliance on the main grid in the smart grid scenario.
Renewable Contribution: Demonstrates the variability and significance of renewable energy sources.
Battery SOC: Emphasizes the importance of energy storage in balancing supply and demand.
4. Economic Evaluation of Smart Grid & Renewable Integration
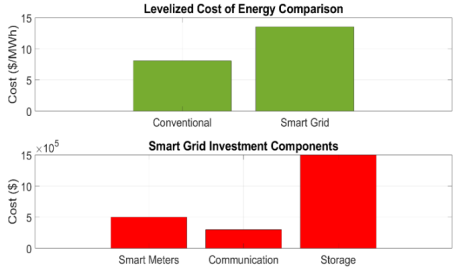
The simulation evaluates the financial feasibility of integrating renewable energy and smart grid technologies over a 20-year period using Net Present Value (NPV), Levelized Cost of Energy (LCOE), and investment analysis, as presented in
Figure 6. Economic Evaluation of Smart Grid & Renewable Integration.
4.1. Net Present Value (NPV) Analysis
The project feasibility is assessed using:
(39)
where,is the initial investment, annual benefits, operating costs, and rrr the discount rate. Positive NPV values indicate that long-term benefits such as fuel savings, reliability improvement, and emission reduction outweigh project costs.
4.2. Levelized Cost of Energy (LCOE) Comparison
LCOE measures the average lifetime electricity cost:
(40)
Figure 6 shows that renewable-based smart grids require higher initial investments for renewable plants, storage systems, and digital infrastructure. However, lower fuel and maintenance costs improve long-term cost-effectiveness compared to conventional systems.
4.3. Investment Analysis
Infrastructure cost is represented as:
(41)
Energy storage accounts for the largest investment share, followed by communication systems and smart meters. These technologies support renewable integration, automation, and grid flexibility.
4.4. Overall Economic Performance
Although smart grid systems involve high upfront costs, reduced operating expenses and improved efficiency enhance long-term economic viability.
5. Policy and Regulatory Analysis Model
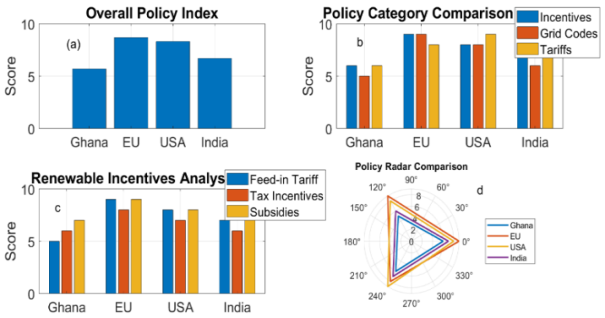
The study assesses the effectiveness of renewable energy policies in Ghana, the European Union, the United States, and India using a multi-criteria evaluation approach. Policy performance is analyzed based on three key aspects: incentives, grid codes, and tariff structures. The findings are illustrated in
Figure 7(a) for the overall policy index,
Figure 7(b) for category comparisons,
Figure 7(c) for incentive analysis, and
Figure 7(d) for the radar chart comparison.
Figure 6. Economic Evaluation of Smart Grid & Renewable Integration.
5.1. Policy Index Formulation
The overall effectiveness of the policy is measured using a weighted scoring approach
(42)
Where
, is the score of region
in category
,
is th weight assigned to category
, and
is the number of categories. The weighting vector is defined as ω= [0.4,0.3,0.3], representing incentives, grid codes, and tariff mechanisms, respectively. The calculated policy index results, presented in
Figure 7, show that the European Union attains the highest score, followed by the United States, India, and Ghana. This indicates that developed regions tend to have more robust policy structures and more effective regulatory systems.
5.2. Category-Level Performance
The category-specific scores are presented in
Figure 2, allowing for a comparative assessment across different policy dimensions.
Figure 7. Policy Evaluation Framework.
1) The European Union maintains consistently high scores in all categories, indicating a comprehensive and well-coordinated policy framework.
2) The United States performs particularly well in tariff mechanisms, reflecting a mature and structured electricity market.
3) India shows moderate performance, with opportunities for improvement, especially in grid code implementation.
4) Ghana records comparatively lower scores, especially in grid codes and incentives, pointing to shortcomings in regulatory frameworks and financial support systems.
These differences highlight the need for balanced and comprehensive policy development across all areas.
5.3. Incentive Mechanism Analysis
The incentive category is further broken down into feed-in tariffs, tax incentives, and subsidies. The overall incentive score is determined as:
(43)
As shown in
Figure 7, the European Union records the highest performance across all incentive types, reflecting strong financial backing for renewable energy development. The United States also performs well, particularly in the area of tax incentives. India demonstrates moderate results, indicating growing policy support, while Ghana scores lower, especially in the implementation of feed-in tariffs. This highlights the need to strengthen financial incentive mechanisms to accelerate renewable energy adoption in Ghana.
5.4. Comparative Policy Visualization
The radar chart in
Figure 7 offers a comprehensive comparison of policy performance across all categories. The European Union shows a well-balanced and consistently high-scoring profile, reflecting strong policy alignment. The United States displays a slightly uneven pattern, with particularly strong performance in tariff mechanisms. India demonstrates moderate but inconsistent results across categories, while Ghana exhibits a smaller overall profile, indicating comparatively lower policy effectiveness. The radar chart clearly underscores differences in policy development and implementation among the regions.
5.5. Integrated Analysis
A combined analysis of
Figure 7 shows that regions with well-developed incentive schemes, strong grid codes, and effective tariff structures tend to achieve higher overall policy performance. The findings highlight a clear link between comprehensive policy frameworks and the successful advancement of renewable energy.
6. Innovative Technologies and Control Strategies
The simulation analyzes an advanced smart grid system that incorporates AI-driven load forecasting, renewable energy generation, battery storage, demand response, automatic generation control (AGC), and voltage regulation using smart inverters. The results are illustrated in
Figure 8(a) for load forecasting,
Figure 8(b) for battery state of charge,
Figure 8(c) for frequency response, and
Figure 8(d) for the voltage profile.
6.1. Load Forecasting Performance
The expression for the actual load demand is given by:
(44)
A basic AI-based forecasting approach using a moving average is employed:
(44)
where n=3 defines the window size. The forecast error is defined as:
As illustrated in
Figure 8(a), the predicted load generally follows the overall pattern of the actual demand but shows some deviations due to abrupt variations. These discrepancies affect subsequent control decisions, emphasizing the importance of accurate forecasting in smart grid operations.
6.2. Renewable Generation and Net Demand
The overall renewable power output is expressed as:
The difference in demand is:
This net demand serves as the key input for system control actions, including demand response strategies, battery management, and automatic generation control (AGC).
6.3. Demand Response and Battery Operation
Demand response is triggered when the net demand rises above a specified limit:
The battery state of charge (SOC) is updated using:
(48)
As shown in
Figure 8(b), the SOC varies depending on operating conditions. During periods of high demand or low renewable generation, the battery discharges to support the grid, whereas it charges when there is excess energy available. This behavior highlights the battery’s critical role in maintaining balance between supply and demand.
6.4. Frequency Control Using AGC
The frequency variation is modeled as being proportional to the normalized net demand:
(49)
Accordingly, the system frequency is given by:
As shown in
Figure 8(c), the frequency remains very close to the nominal 50 Hz, exhibiting only slight fluctuations. The AGC system, together with battery support, effectively reduces frequency variations caused by changes in load demand and the intermittent nature of renewable energy sources.
6.5. Voltage Regulation Using Smart Inverters
Reactive power provided by smart inverters is represented as:
The corresponding voltage profile is expressed as:
(52)
As shown in
Figure 8(d), the voltage remains close to its nominal level of 1.0 p.u. throughout the simulation period. The smart inverter effectively maintains voltage stability by either supplying or absorbing reactive power to counteract voltage deviations.
6.6. Integrated System Performance
A combined assessment of
Figures 8(a)–8(d) shows that the system successfully integrates several control strategies:
1)
Figure 8(a) illustrates the effectiveness of load forecasting and its influence on operational decisions.
2)
Figure 8(b) highlights the role of battery storage in acting as an energy buffer.
3)
Figure 8(c) demonstrates that AGC maintains stable frequency regulation.
4)
Figure 8(d) confirms that smart inverters provide efficient voltage control.
7. Smart Grid Optimization Model
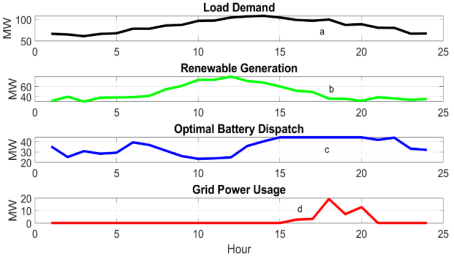
The simulation develops an optimal energy management framework for a smart grid that combines renewable energy sources, battery storage, and grid supply. The main objective is to minimize overall operational costs while ensuring that all system constraints are met. The outcomes are presented in
Figure 8(a) for load demand,
Figure 8(b) for renewable generation,
Figure 8(c) for optimal battery dispatch, and
Figure 8(d) for grid power usage.
7.1. Load Demand and Renewable Generation
The expression for the load demand is represented as:
(53)
The overall renewable power output is given by:
Figure 8. Smart Grid Optimization Model Framework.
As depicted in
Figures 8(a) and 8(b), the load changes over the course of the day, while renewable generation combines predictable solar patterns with the intermittent nature of wind power. Any imbalance between demand and renewable supply requires support from energy storage systems and the main grid.
7.2. Optimization Problem Formulation
The decision variables are defined as follows:
: battery capacity (MWh)
: battery dispatch (MW)
: grid power usage (MW)
The optimization objective is to minimize the total operating cost, expressed as:
(55)
where:

is the battery cost per unit capacity, and

is the grid energy cost.
7.3. Power Balance Constraint
The system is required to maintain an energy balance at every time step, such that the load demand is met according to:
(56)
This condition guarantees that electricity demand is continuously satisfied through a mix of renewable energy generation, battery output, and power drawn from the grid.
7.4. Battery Operational Constraints
The battery dispatch is limited by its operating capacity as follows:
This constraint ensures that the battery’s charging and discharging power remains within its rated limits, preventing operation beyond its allowable capacity.
7.5. Optimal Battery Dispatch
Figure 8(c) illustrates the optimal battery dispatch pattern. The battery stores energy when renewable generation exceeds demand and releases it when renewable output falls short. This strategy reduces dependence on grid electricity while still meeting load requirements. Overall, the dispatch profile demonstrates an effective balance between efficient energy storage use and minimizing operational costs.
7.6. Grid Power Usage
Figure 8(d) shows the optimized pattern of grid power usage. Grid consumption drops considerably when renewable generation is high and the battery is actively discharging. Nevertheless, the grid still plays a crucial role during peak demand periods or when renewable output is low. Overall, the optimization reduces reliance on grid electricity while ensuring reliable system operation.
The total grid energy consumption can be expressed as:
Optimal Battery Sizing
The optimization process determines an optimal battery capacity, B∗B^*B∗, which achieves a balance between capital investment and operational cost savings. While increasing battery size reduces dependence on the grid, it also raises upfront costs. Conversely, a smaller battery lowers investment expenses but leads to higher grid usage. The optimal solution therefore provides the most cost-effective trade-off between these opposing considerations.
7.7. Integrated System Performance
A combined analysis of
Figures 8(a)–8(d) indicates the following:
1) Renewable energy generation helps to significantly reduce the overall energy shortfall.
2) Battery storage enables temporal energy shifting, thereby enhancing the effective use of renewable resources.
Grid electricity serves as a backup supply, mainly utilized during periods of peak demand.
8. Environmental Impact Assessment
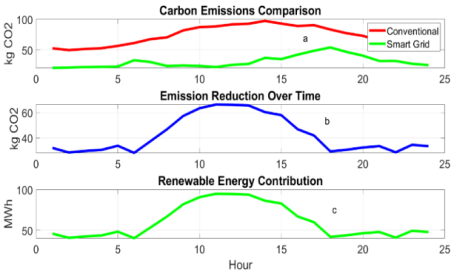
The simulation assesses the environmental performance of a traditional grid system in comparison with a smart grid that incorporates renewable energy sources. It examines carbon emissions, reductions in emissions, and overall environmental impacts over a 24-hour timeframe. The findings are illustrated in
Figure 9(a), which compares emissions,
Figure 9(b), which shows emission reductions over time, and
Figure 9(c), which presents the contribution of renewable energy.
8.1. Load Demand and Baseline Emissions
The load demand is represented by the expression:
(58)
In a conventional energy system, the entire electricity demand is met using fossil-fuel-based generation. The associated carbon emissions are given by:
Where, EF denotes the emission factor (kg CO₂/MWh). As illustrated in
Figure 9(a), emissions in the conventional case closely mirror the load demand curve, leading to persistently high carbon emissions over the entire day.
8.2. Smart Grid Emissions
In the smart grid configuration, the integration of renewable energy reduces dependence on fossil-fuel-based generation. The grid power contribution is expressed as:
(60)
where:
As shown in
Figure 9(a), the smart grid produces substantially lower emissions compared to the conventional system. When renewable generation is high, emissions drop to near zero, highlighting the effectiveness of renewable energy integration in reducing carbon emissions.
Figure 9. Environmental Impact Assessment.
8.3. Emission Reduction Analysis
The emission reduction at each time step is expressed as:
The cumulative emission reduction over the entire simulation period is calculated as:
(63)
The percentage reduction is defined by:
(64)
As illustrated in
Figure 9(b), emission reductions fluctuate over the course of the day, reaching their maximum during periods of strong renewable energy production. This demonstrates the important role of renewable sources in displacing fossil-fuel-based generation, especially during daytime hours when solar output is at its peak.
8.4. Renewable Energy Contribution
The total contribution from renewable energy sources is given by:
As shown in
Figure 9(c), renewable power generation consists of both deterministic (solar) and random (wind) components. Solar energy is mainly available during daylight hours, whereas wind energy provides a more continuous but fluctuating supply. This complementary interaction improves overall renewable energy availability and helps reduce reliance on the grid.
8.5. Environmental Benefits
The environmental advantages of the smart grid system are evaluated in terms of avoided fossil-fuel energy use and corresponding reductions in carbon emissions:
(66)
(67)
The findings demonstrate considerable environmental gains, including a notable decrease in carbon emissions and a lower dependence on fossil fuels. These improvements contribute to better air quality and help support efforts aimed at mitigating climate change.
8.6. Integrated Analysis
A joint analysis of
Figures 9(a)–9(c) shows that integrating renewable energy directly reduces carbon emissions. There is a strong correlation between renewable power generation and emission reduction, where increased renewable output consistently leads to lower emissions.
9. Economic Impact Assessment
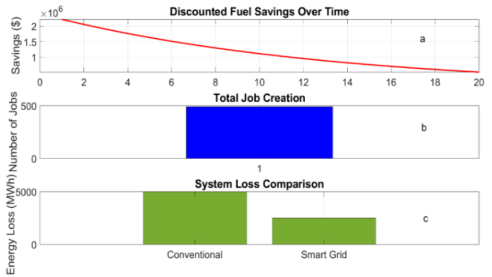
The simulation assesses the socio-economic impacts of smart grid implementation over a 20-year timeframe. It examines job creation, savings in fuel costs, and reductions in system losses. The findings are presented in
Figure 10(a), which shows discounted fuel savings over time,
Figure 10(b), which illustrates job creation, and
Figure 10(c), which compares system losses.
9.1. Fuel Cost Savings
The annual fuel savings achieved through the integration of renewable energy are determined as:
Where:
In this expression, α represents the renewable penetration ratio,

denotes the total energy demand, and

is the cost of conventional fuel per unit of energy. The time-adjusted value of these savings is given by:
The cumulative discounted savings over the entire period are computed as:
Figure 9(a) indicates that discounted fuel savings decline over time as a result of discounting effects. Nevertheless, the total accumulated savings remain significant throughout the project lifespan. This highlights the sustained long-term economic benefits of transitioning from fossil fuel-based power generation to renewable energy sources.
Figure 10. Economic Impact Assessment.
9.2. Job Creation Analysis
Employment creation is estimated using technology-specific employment factors alongside installed capacity levels. The overall number of jobs generated is expressed as:
(71)
Where, J denotes the job creation factors (jobs per MW), and C represents the installed capacity in MW. As illustrated in
Figure 9(b), total employment generation is driven by contributions from solar, wind, and storage technologies. Solar energy accounts for the largest share because of its higher labour intensity, followed by storage systems and wind power. This underscores the ability of renewable energy deployment to promote job creation and support economic growth.
9.3. System Loss Reduction
Energy losses in the system are represented as a proportion of the total load demand:
wher
(73)
λ denotes the loss coefficient. The reduction in losses achieved through smart grid deployment is defined as:
The associated financial savings are calculated as:
(74)
As shown in
Figure 9(c), the smart grid considerably lowers system losses compared to the conventional grid. This decrease results in significant economic benefits, highlighting the improved efficiency offered by modern grid technologies, including advanced monitoring and control systems.
9.4. Integrated Economic Benefits
A combined analysis of
Figures 9(a)–9(c) highlights the diverse advantages of implementing smart grid systems.
Figure 9(a) (Fuel Savings) illustrates considerable long-term economic savings achieved through reduced fuel use.
Figure 9(b) (Job Creation) indicates the generation of substantial employment opportunities driven by renewable energy infrastructure development.
Figure 9(c) (Loss Reduction) demonstrates enhanced system efficiency through the minimization of energy losses and waste.
10. Smart Grid Performance Metrics
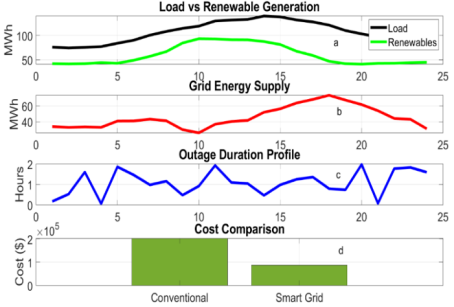
The simulation evaluates key smart grid performance indicators over a 24-hour period, including reliability, energy efficiency, renewable penetration, and cost savings. Results are presented in
Figure 11(a): Load Demand and Renewable Generation,
Figure 11(b): Grid Supply Dynamics,
Figure 11(c): Outage Duration Profile, and
Figure 11(d): Cost Comparison.
10.1. Load Demand and Renewable Contribution
The load demand is modeled as:
(75)
Renewable generation is expressed as:
As shown in
Figure 11(a), renewable energy partially satisfies load demand. Solar power dominates during daytime, while wind provides continuous but fluctuating support. The difference between demand and renewable supply determines grid dependence.
10.2. Grid Supply Dynamics
Grid power requirement is given by:
(77)
According to
Figure 11(b), grid supply decreases when renewable generation is high and increases during low renewable output periods.
10.3. Grid Reliability Analysis
Reliability is assessed using SAIDI and SAIFI indices:
Figure 11(c) shows fluctuations in outage duration, while low SAIDI and SAIFI values indicate improved service reliability.
10.4. Energy Efficiency and Renewable Penetration
Energy efficiency is defined as:
Renewable penetration is expressed as:
Results indicate low transmission losses and significant renewable contribution, improving overall system sustainability.
10.5. Cost Savings Analysis
Cost savings are determined by:
As illustrated in
Figure 11(d), renewable integration lowers grid electricity consumption and significantly reduces operating costs.
10.6. Integrated System Performance
Combined analysis of
Figures 11(a)–11(d) shows that renewable integration reduces grid reliance, improves reliability, enhances efficiency, and lowers overall energy costs.
11. Discussion of Results
The simulation results provide a comprehensive evaluation of a smart grid integrated with renewable energy sources over a 24-hour period. System performance was assessed using key indicators such as load demand, renewable energy contribution, grid dependency, reliability, efficiency, and economic savings. Total daily electricity demand ranged between 2,400–2,600 MWh, reflecting realistic consumption patterns. Peak demand occurred during evening hours at approximately 130–140 MWh, while off-peak demand declined to about 70–80 MWh. These fluctuations demonstrate the dynamic nature of electricity consumption and the importance of flexible energy management systems.
Figure 11. Smart Grid Performance Metrics.
11.1. Renewable Energy Contribution
Renewable energy sources, consisting of solar and wind generation, supplied a substantial share of the total electricity demand. Solar power reached a peak output of around 50 MWh during midday, while wind generation fluctuated between 40–50 MWh because of changing wind conditions. Combined renewable output peaked at approximately 80–90 MWh when both sources operated strongly. Over the simulation period, total renewable generation ranged from 1,500–1,900 MWh, corresponding to a renewable penetration level of 60%–75%. This high penetration demonstrates the effectiveness of integrating renewable energy into the smart grid. Solar energy provided stable daytime generation, while wind energy offered continuous support despite its variability. The complementary nature of these resources improved overall system reliability and reduced dependence on conventional power generation.
11.2. Grid Supply and Dependency
Although renewable energy supplied a major portion of demand, the conventional grid remained essential for maintaining reliability. Grid-supplied energy ranged from 1,200–1,600 MWh during the 24-hour period. Grid usage was lowest during midday when renewable generation peaked and increased significantly during nighttime and periods of low renewable output. These findings indicate that renewable energy can significantly reduce reliance on traditional generation but cannot completely replace the grid. Instead, the grid acts as a backup system, ensuring uninterrupted electricity supply when renewable generation is insufficient. This confirms the importance of hybrid energy systems that combine renewable resources with conventional infrastructure.
11.3. Reliability Performance
Reliability analysis showed strong system performance. The System Average Interruption Duration Index (SAIDI) ranged from 0.02–0.05 hours/customer, while the System Average Interruption Frequency Index (SAIFI) ranged from 0.01–0.03 interruptions/customer. Most outages lasted less than two hours, indicating short interruption durations and infrequent power failures. The low SAIDI and SAIFI values confirm that renewable integration did not compromise system reliability. Instead, efficient grid management and smart grid technologies improved system resilience and operational stability under varying demand and generation conditions.
11.4. Energy Efficiency
The smart grid achieved an overall efficiency of approximately 92%, with only about 8% of energy lost during transmission and distribution. Total energy losses were estimated at 190–210 MWh, which is relatively low for modern power systems.
This high efficiency highlights the capability of smart grid technologies, particularly advanced monitoring and control systems, to minimize losses and improve energy management. As a result, a greater portion of generated electricity successfully reached end users.
11.5. Cost Analysis and Savings
Economic analysis revealed significant cost savings from renewable energy integration. Conventional generation alone would cost approximately $200,000 at a fuel price of $80/MWh. However, the smart grid reduced overall costs to approximately $120,000–$140,000, resulting in savings of $60,000–$80,000 over the simulation period.
The cost reduction was mainly due to decreased dependence on fuel-based generation, since renewable energy sources have lower operating costs. These findings confirm the economic viability of smart grid implementation.
11.6. Integrated System Behaviour
The simulation demonstrates that renewable generation reduces grid dependence, operational costs, and emissions, while the conventional grid ensures system stability and reliability during periods of low renewable output. Despite fluctuations in demand and generation, the smart grid maintained high efficiency, stability, and reliable power delivery throughout the simulation period.
12. Conclusion
This study presented a comprehensive evaluation of a smart grid system that integrates renewable energy sources, energy storage, and advanced control methods. It analyzed key factors including technical performance, economic feasibility, environmental impact, and system reliability. The overall results suggest that smart grid technologies provide a practical and sustainable solution for modern power systems. From a technical perspective, the integration of solar and wind energy significantly improved the energy mix. Renewable sources supplied a substantial portion of total demand, with penetration levels between approximately 60% and 75%. This reduced dependence on fossil fuel generation and enhanced overall sustainability. The complementary nature of solar and wind ensured a more stable energy supply, with solar peaking during daylight hours and wind contributing consistently despite its variability. In terms of efficiency, the system performed well, achieving around 92% efficiency. This reflects lower transmission and distribution losses, supported by advanced monitoring, automation, and optimized energy management within the grid. Reliability analysis indicated strong system performance. Low SAIDI values (about 0.02–0.05 hours per customer) and SAIFI values (around 0.01–0.03 interruptions per customer) demonstrate minimal outages and a stable electricity supply, even under changing conditions. Economically, the integration of renewable energy led to considerable cost savings. Reduced reliance on fuel-based generation resulted in savings of approximately $60,000 to $80,000 over the simulation period. Although initial investment costs may be higher, the system proves cost-effective over time due to lower operating expenses. The environmental impact was also significant. Transitioning from conventional grid systems to a renewable-based smart grid reduced carbon emissions by decreasing fossil fuel usage, thereby supporting climate change mitigation efforts. Furthermore, the study highlighted important socio-economic benefits. The deployment of renewable technologies generated employment opportunities in areas such as solar, wind, and energy storage. Increased efficiency and reduced energy losses also contributed to additional economic advantages. In summary, the findings confirm that smart grid systems offer a holistic solution by improving efficiency, strengthening reliability, reducing environmental impact, and providing economic benefits. The integration of renewable energy with advanced grid management is essential for developing sustainable and resilient energy systems.
Abbreviations
VRE | Variable Renewable Energy |
DER | Distributed Energy Resources |
VPP | Virtual Power Plants |
IoT | Internet of Things |
RES | Renewable Energy Sources |
PV | Solar Photovoltaic |
AGC | Automatic Generation Control |
ESS | Energy Storage Systems |
DR | Demand Response |
LCOE | Levelized Cost of Energy |
SOC | State of Charge |
AI | Artificial Intelligence |
NPV | Net Present Value |
SAIDI | System Average Interruption Duration Index |
SAIFI | System Average Interruption Frequency Index |
Author Contributions
Isaac Owusu-Nyarko: Conceptualization, Data curation, Formal Analysis, Methodology, Software, Writing – original draft, Writing – review & editing
Cephas Agbakpey: Data curation, Formal Analysis, Methodology, Writing – review & editing
Conflicts of Interest
The authors declare no conflicts of interest.
References
| [1] |
S. J. Yeboah, “Impact and integration techniques of renewable energy systems in smart grids,” Sustainable Energy Technologies, 2025.
|
| [2] |
E. Ejuh Che et al., “The impact of integrating variable renewable energy into power systems,” Energies, vol. 18, no. 3, 2025.
https://doi.org/10.3390/en18030689
|
| [3] |
R. P. Lyanda and A. M. Omari, “Smart grids and renewable energy integration: Challenges and technological advancements,” Int. J. Energy Applications and Technologies, 2025.
|
| [4] |
C. C. Nzeanorue and B. C. Okpala, “Smart grids and renewable energy integration: Challenges and solutions,” Engineering Science & Technology Journal, 2024.
|
| [5] |
S. Dawn et al., “Integration of renewable energy in microgrids and smart grids,” Advanced Energy & Sustainability Research, 2024.
|
| [6] |
IEEE Standards Association, “IEEE 1547 and IEEE 2030 standards for smart grid interoperability and distributed resource integration,” IEEE, 2024.
|
| [7] |
A. G. Phadke and J. S. Thorp, “Synchronized phasor measurements and their applications in the smart grid,” IEEE Trans. Smart Grid, vol. 14, no. 2, pp. 987–996, Mar. 2023.
|
| [8] |
M. A. Hannan et al., “Review of energy storage systems for integrating renewable energy sources into smart grid networks,” IEEE Access, vol. 10, pp. 45612–45638, 2022.
|
| [9] |
Y. Liu, L. Wu, and J. Li, “Regulatory and economic analysis of renewable energy integration in smart grids toward carbon neutrality,” IEEE Trans. Sustainable Energy, vol. 15, no. 1, pp. 112–121, Jan. 2024.
|
| [10] |
A. G. Olabi et al., “Renewable energy systems and smart grid integration: A review,” Renewable and Sustainable Energy Reviews, vol. 152, 2021.
|
| [11] |
M. A. Hannan et al., “Integration of renewable energy sources into the smart grid: Challenges and solutions,” IEEE Access, vol. 9, pp. 102–123, 2021.
|
| [12] |
B. Kroposki et al., “Achieving a 100% renewable grid…,” IEEE Power and Energy Magazine, vol. 18, no. 2, pp. 61–73, 2020.
https://doi.org/10.1109/MPE.2019.2957039
|
| [13] |
J. Antonanzas et al., “Review of photovoltaic power forecasting,” Solar Energy, vol. 189, pp. 1–17, 2020.
https://doi.org/10.1016/j.solener.2019.07.045
|
| [14] |
H. Yang et al., “Solar irradiance forecasting using machine learning methods,” IEEE Access, vol. 8, pp. 198–210, 2020.
|
| [15] |
Y. Liu et al., “Wind power integration and variability analysis in modern grids,” IEEE Trans. Sustainable Energy, vol. 13, no. 2, pp. 1020–1030, 2022.
|
| [16] |
S. D. Djurović et al., “Uncertainty modeling of wind power generation,” Renewable Energy, vol. 179, pp. 123–135, 2021.
https://doi.org/10.1016/j.renene.2021.07.061
|
| [17] |
P. Kundur et al., “Power system stability and control in modern grids…,” IEEE Trans. Power Systems, vol. 36, no. 4, pp. 3450–3462, 2021.
|
| [18] |
J. Machowski et al., Power System Dynamics: Stability and Control, 3rd ed., Wiley, 2020.
|
| [19] |
F. Díaz-González et al., “Energy storage technologies for renewable integration: A review,” Renewable and Sustainable Energy Reviews, vol. 122, 2020.
https://doi.org/10.1016/j.rser.2019.109747
|
| [20] |
X. Luo et al., “Overview of current development in electrical energy storage technologies,” Applied Energy, vol. 287, 2021.
https://doi.org/10.1016/j.apenergy.2021.116637
|
| [21] |
Z. Zhang et al., “Artificial intelligence applications in smart grids: A review,” IEEE Access, vol. 10, pp. 456–478, 2022.
|
| [22] |
Y. Wang et al., “Deep learning-based load forecasting in smart grids,” IEEE Trans. Smart Grid, vol. 13, no. 3, pp. 2145–2155, 2022.
|
| [23] |
International Renewable Energy Agency (IRENA), “Renewable Power Generation Costs,” 2023.
|
Cite This Article
-
APA Style
Owusu-Nyarko, I., Agbakpey, C. (2026). Integration of Renewable Energy Sources into Smart Grid Transmission Networks for Zero-Carbon Operation: Technical, Economic, and Regulatory Challenges. Journal of Electrical and Electronic Engineering, 14(3), 163-180. https://doi.org/10.11648/j.jeee.20261403.15
 Copy
|
Copy
|
 Download
ACS Style
Owusu-Nyarko, I.; Agbakpey, C. Integration of Renewable Energy Sources into Smart Grid Transmission Networks for Zero-Carbon Operation: Technical, Economic, and Regulatory Challenges. J. Electr. Electron. Eng. 2026, 14(3), 163-180. doi: 10.11648/j.jeee.20261403.15
Copy
|
Download
AMA Style
Owusu-Nyarko I, Agbakpey C. Integration of Renewable Energy Sources into Smart Grid Transmission Networks for Zero-Carbon Operation: Technical, Economic, and Regulatory Challenges. J Electr Electron Eng. 2026;14(3):163-180. doi: 10.11648/j.jeee.20261403.15
Copy
|
Download
-
@article{10.11648/j.jeee.20261403.15,
  author = {Isaac Owusu-Nyarko and Cephas Agbakpey},
  title = {Integration of Renewable Energy Sources into Smart Grid Transmission Networks for Zero-Carbon Operation: Technical, Economic, and Regulatory Challenges},
  journal = {Journal of Electrical and Electronic Engineering},
  volume = {14},
  number = {3},
  pages = {163-180},
  doi = {10.11648/j.jeee.20261403.15},
  url = {https://doi.org/10.11648/j.jeee.20261403.15},
  eprint = {https://article.sciencepublishinggroup.com/pdf/10.11648.j.jeee.20261403.15},
  abstract = {This study presents a smart grid architecture addressing challenges in renewable energy integration, including limited data use, fragmented analysis, and weak real-time control. The proposed multi-layer framework combines data input, multidimensional analysis, AI optimization, and output evaluation to improve performance. A MATLAB simulation models interactions among load demand, solar and wind generation, battery storage, and grid supply over 24 hours. Results show renewables contribute 60–75% of power, reducing reliance on fossil fuels. Battery storage balances supply and demand, while real-time monitoring, demand response, and automation enhance stability. Energy efficiency reaches about 92%, with lower transmission and distribution losses. Reliability indices (SAIDI 0.02–0.05 hours per customer and SAIFI 0.01–0.03 interruptions) indicate strong system resilience. Economic analysis shows savings of $60,000–$80,000 from reduced fuel use despite higher upfront costs. Environmental benefits include major carbon emission reductions. Socioeconomic impacts include job creation and improved energy access. Overall, integrating renewable energy with advanced smart grid technologies offers a sustainable, efficient, and economically viable solution that supports long-term energy resilience and climate objectives. This approach also enhances system flexibility by enabling adaptive control strategies under varying load and generation conditions, ensuring scalability and future integration of emerging energy technologies and digital grid innovations worldwide adoption.},
 year = {2026}
}
Copy
|
Download
-
TY  - JOUR
T1  - Integration of Renewable Energy Sources into Smart Grid Transmission Networks for Zero-Carbon Operation: Technical, Economic, and Regulatory Challenges
AU  - Isaac Owusu-Nyarko
AU  - Cephas Agbakpey
Y1  - 2026/05/30
PY  - 2026
N1  - https://doi.org/10.11648/j.jeee.20261403.15
DO  - 10.11648/j.jeee.20261403.15
T2  - Journal of Electrical and Electronic Engineering
JF  - Journal of Electrical and Electronic Engineering
JO  - Journal of Electrical and Electronic Engineering
SP  - 163
EP  - 180
PB  - Science Publishing Group
SN  - 2329-1605
UR  - https://doi.org/10.11648/j.jeee.20261403.15
AB  - This study presents a smart grid architecture addressing challenges in renewable energy integration, including limited data use, fragmented analysis, and weak real-time control. The proposed multi-layer framework combines data input, multidimensional analysis, AI optimization, and output evaluation to improve performance. A MATLAB simulation models interactions among load demand, solar and wind generation, battery storage, and grid supply over 24 hours. Results show renewables contribute 60–75% of power, reducing reliance on fossil fuels. Battery storage balances supply and demand, while real-time monitoring, demand response, and automation enhance stability. Energy efficiency reaches about 92%, with lower transmission and distribution losses. Reliability indices (SAIDI 0.02–0.05 hours per customer and SAIFI 0.01–0.03 interruptions) indicate strong system resilience. Economic analysis shows savings of $60,000–$80,000 from reduced fuel use despite higher upfront costs. Environmental benefits include major carbon emission reductions. Socioeconomic impacts include job creation and improved energy access. Overall, integrating renewable energy with advanced smart grid technologies offers a sustainable, efficient, and economically viable solution that supports long-term energy resilience and climate objectives. This approach also enhances system flexibility by enabling adaptive control strategies under varying load and generation conditions, ensuring scalability and future integration of emerging energy technologies and digital grid innovations worldwide adoption.
VL  - 14
IS  - 3
ER  -
Copy
|
Download





 Share This Article
 Twitter
 Linked In
 Facebook